Atlas of Mortality in Spanish Municipalities and Census Tracts (1984-2004)
Methodology: Geographical unit and geographical methods > Geographical unit
In Spain the availability of geographical and statistical data makes it possible to conduct mortality studies at a very small geographical scale. This is the case for example of the 8,077 municipalities in existence at the time of the 1991 census. However, in order to analyse this information, it was necessary first to solve a number of problems. Firstly, due to the number of deaths in many municipalities was too small to obtain stable death rates. Secondly, for confidentiality reasons, vital statistics legislation restricts the use of mortality information in the smallest municipalities. Thirdly, municipalities were very heterogeneous in their population size. In order to overcome these problems it was necessary to construct small areas or 'zones' with similar social and demographic characteristics. Thus, a previous study covering Spain as a whole based initially on municipalities, applied Geographical Information System (GIS) techniques and a method based on three main criteria (contiguity of the small areas, similarity of socioeconomic indicators, and a minimum population size) to construct 2,220 geographical zones with at least 3,500 inhabitants (15). The rationale, and specific methods and steps followed in this process are summarised in Appendix I.
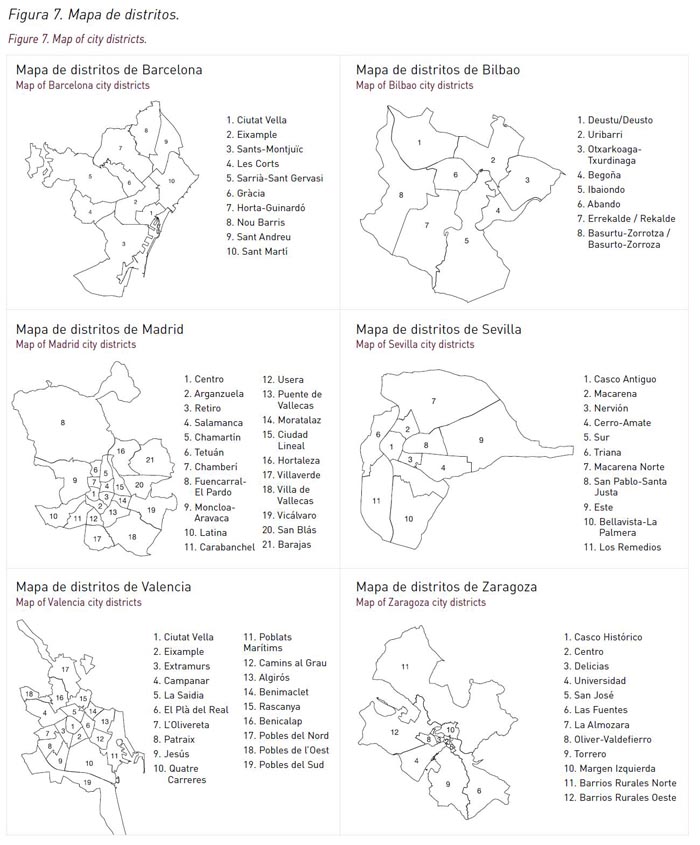
For assessment of trends in the relative mortality risk, seven three-year time periods were formed: 1984 to 1986 (period 1), 1987 to 1989 (period 2), 1990 to 1992 (period 3), 1993 to 1995 (period 4), 1996 to 1998 (period 5), 1999 to 2001 (period 6) and 2002 to 2004 (period 7). Furthermore, given that Barcelona, Bilbao, Madrid, Seville, Valencia and Zaragoza are large cities, it is important to have data for smaller areas. Therefore, we conducted a study including the 2,218 small areas of Spain jointly with the census tracts from these cities for the period 1996-2003. The census tract is the smallest unit of analysis for which information is available. These areas have been homogenised using as a reference the 2001 Spanish Population and Housing Census obtaining 1,491 census tracts for Barcelona, 288 in Bilbao, 2,358 for Madrid, 510 in Seville, 598 in Valencia and 462 for Zaragoza. The homogenization of the census tracts units and mortality and population data was obtained in a previous study ("Desigualdades Socioeconómicas y Medioambientales en la mortalidad en ciudades deEspaña" (proyecto MEDEA)) (14).
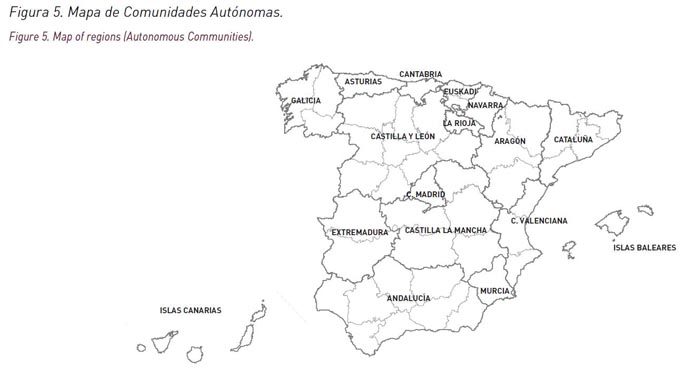
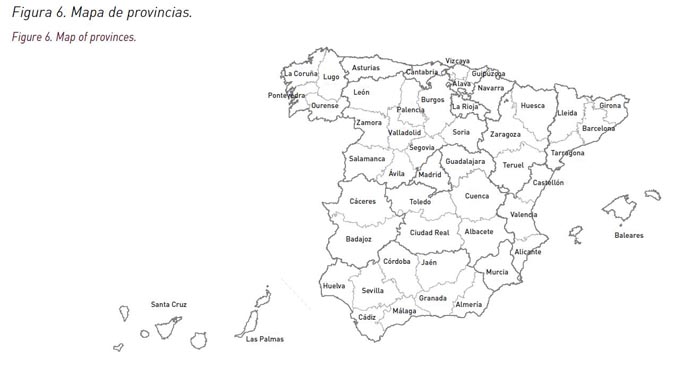
To facilitate the geographical interpretation of the results, a map at the regional level (Autonomous Communities) (Figure 5) and another at the province level (Figure 6) are included. In addition, a map with districts is included for each city (Figure 7).


In this Atlas, the original number of zones previously used in other studies had to be reduced by two, i.e., 2,218 areas, because of the lack of available data in the two Spanish northern African cities of Ceuta and Melilla. A summary of demographic and geographical information at different spatial levels (provinces, municipalities and zones) by Autonomous Communities is shown in Table 1.


